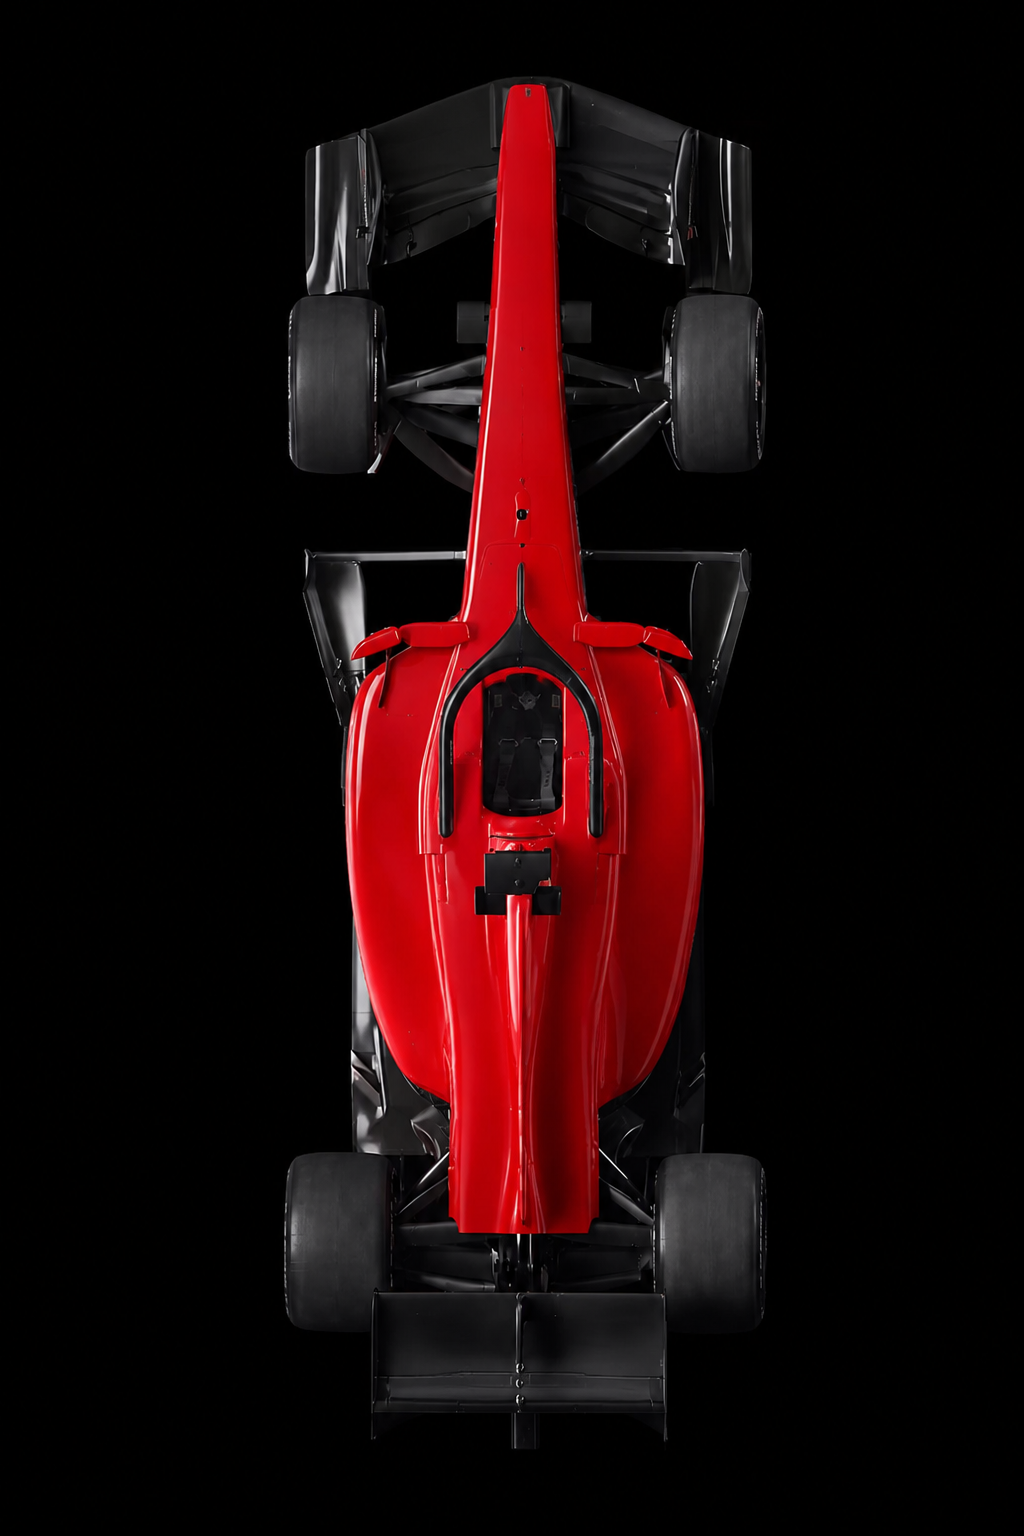
Every Grand Prix generates thousands of data points: lap times, sector splits, pit stops, tyre compounds, and gaps to the car ahead. Most fans see the leaderboard. Analysts see a story about pace, degradation, and decision quality. This guide explains the metrics that separate noise from signal.
70+
Timing loops
Per circuit, sector-by-sector
3
Tyre compounds
Soft, medium, hard (typical weekend)
0.1s
Pit-lane delta
Typical cost vs on-track time
Race pace vs. qualifying pace
Qualifying rewards one flying lap. Race pace rewards consistency over 50–70 laps. The gap between the two is often the most revealing number of a weekend. A driver who qualifies P3 but runs P7 race pace usually points to tyre management issues, car balance in dirty air, or a strategy that forced an early pit.
Tyre degradation curves
Tyres are the hidden variable in every race. Degradation is measured as seconds lost per lap relative to a driver's first five stints on the same compound. A steep curve means the team must pit earlier; a flat curve enables one-stop strategies or undercuts.
| Pattern | Typical signal | Strategic implication |
|---|---|---|
| Flat first 10 laps, cliff after | Thermal or graining issue | Early stop or extend to avoid traffic |
| Linear loss ~0.05s/lap | Controlled wear | One-stop viable on medium-hard |
| Sudden drop after SC | Cold tyres + restart | Track position > pit delta |
Undercut, overcut, and pit windows
An undercut works when fresh tyres gain more time than the pit stop costs — typically 20–25 seconds on a two-stop circuit. An overcut works when the leading car cannot heat tyres quickly after stopping. Data teams model both scenarios lap-by-lap using live degradation rates.
“Strategy is not guessing the right lap. It is updating a probability model every time a sector time arrives.”
Using Debrief for race analysis
On Debrief, race results, pit logs, and prediction models share the same historical base — so you can compare a driver's current form against their rolling pace and reliability scores. Start with the Race center for raw timing, then cross-check driver analytics for whether a result was performance or variance.
Key takeaways
- Median lap in clean air beats fastest lap for race performance.
- Degradation shape determines strategy more than raw pace.
- Pit-stop timing is a math problem updated live, not a fixed plan.
- Always compare race pace to qualifying — the delta explains surprises.